Mastering the ability to read futures trading charts is a key skill that separates successful traders from the rest. These charts offer insights into price movements, market trends, and potential opportunities, but can often appear overwhelming to beginners. In this post, we will break down the process of reading a futures trading chart, offering practical insights that will help both novice and advanced traders navigate the complexities of the futures market with ease.
Table of Contents
Understanding the Basics of Futures Trading Charts
Before diving into advanced techniques, it’s crucial to understand the foundational elements of a futures trading chart. Most charts display the price movement of a futures contract over a specific period of time, but what sets them apart are the various indicators and patterns that signal trading opportunities.
In this guide, we’ll explore key aspects such as candlestick patterns, moving averages, volume indicators, and trend lines. Whether you’re aiming to identify trends or execute precise trades, learning how to interpret these features is essential.
1. The Candlestick Chart: Your Starting Point
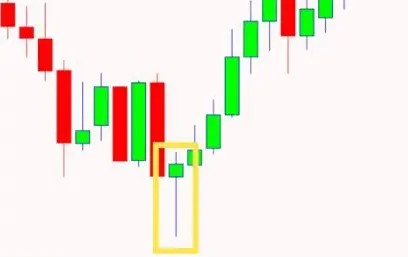
Candlestick charts are one of the most popular tools for futures traders. Each “candle” represents price movements over a given period, with the body of the candle showing the opening and closing prices, and the wicks (or shadows) indicating the highest and lowest prices during that time frame.
Key Elements of Candlesticks:
Body: Indicates the price range between the open and close.
A green (or white) body means the price closed higher than it opened (bullish candle).
A red (or black) body means the price closed lower than it opened (bearish candle).
Wicks: The vertical lines extending from the body show the high and low prices within that period.
Why It Matters: Candlestick patterns, such as doji, hammer, and engulfing patterns, provide insights into market sentiment. For example, a hammer pattern often indicates a potential reversal in an upward trend, signaling an opportunity to buy.

2. Moving Averages: Identifying Trends with Precision
Moving averages (MAs) smooth out price data to help traders identify trends by filtering out short-term price fluctuations. There are two main types of moving averages:
Simple Moving Average (SMA):
A calculation of the average price over a set number of periods.
Exponential Moving Average (EMA):
Places more weight on recent prices, making it more responsive to current market conditions.
How to Use Moving Averages:
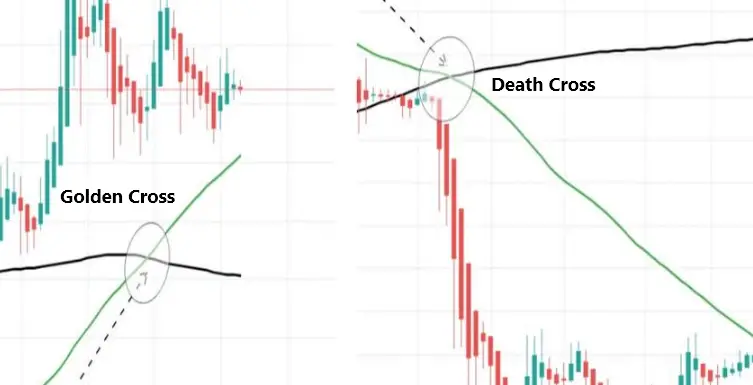
Golden Cross:
When the short-term MA crosses above the long-term MA, it signals a potential buying opportunity.
Death Cross:
When the short-term MA crosses below the long-term MA, it signals a potential selling opportunity.
Practical Example: A trader might use a 50-day SMA and a 200-day SMA to track long-term trends. If the 50-day SMA crosses above the 200-day SMA, it may suggest that the market is entering a bullish phase, encouraging the trader to enter a long position.

3. Volume Indicators: Assessing Market Strength
Volume measures the number of contracts traded during a specific time period. It is a vital indicator for confirming trends and understanding the strength of a market move. A spike in volume often signals that a significant price move is about to occur.
How to Read Volume:
Rising Volume + Price Increase: Indicates strong bullish momentum.
Rising Volume + Price Decrease: Suggests strong bearish momentum.
Decreasing Volume: May indicate a weakening trend and potential reversal.
Practical Tip: If you’re considering entering a trade based on a price breakout, confirm the move with rising volume. If the breakout occurs on low volume, it could be a false signal.
4. Support and Resistance Levels: Key Decision Points
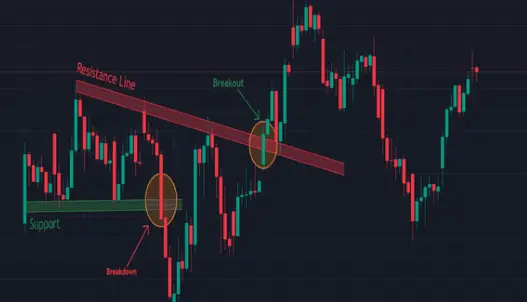
Support and resistance levels are critical for setting entry and exit points. Support is the price level where an asset tends to stop falling, while resistance is where it tends to stop rising.
How to Identify Support and Resistance:
Support: Look for historical price lows where the asset has repeatedly bounced back.
Resistance: Identify historical price highs where the asset has struggled to break through.
Using Support and Resistance:
Breakouts: When the price breaks through a resistance level with high volume, it can signal a new upward trend.
Bounces: If the price bounces off a support level, it could be a good time to enter a long position.
Example: If a futures contract repeatedly drops to $50 but never falls below it, $50 is considered a strong support level. Traders might place buy orders near this level, expecting a price bounce.

5. Trend Lines: Drawing a Clear Path
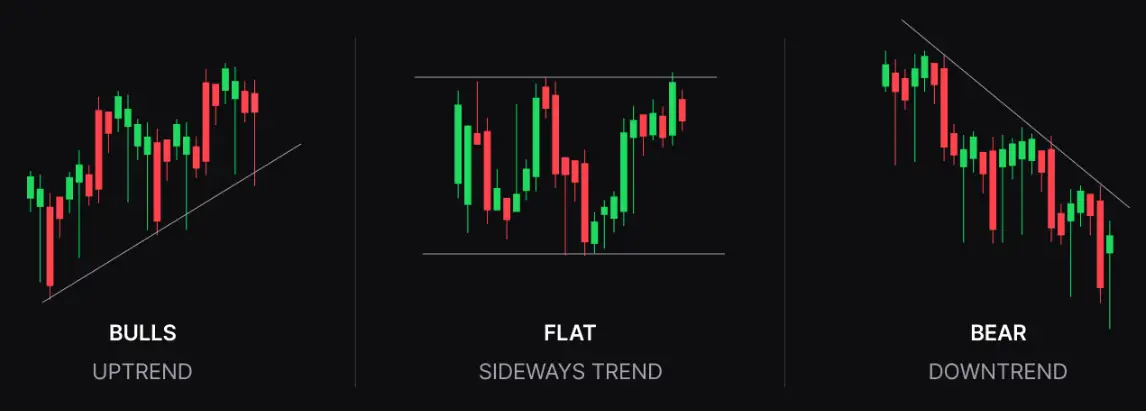
Trend lines are straight lines drawn on a chart to connect significant price points, helping to define the market’s direction.
How to Draw Trend Lines:
Uptrend Line: Drawn by connecting successive higher lows in a rising market.
Downtrend Line: Drawn by connecting successive lower highs in a falling market.
How to Use Trend Lines:
Breakouts: A price breaking above a downtrend line can indicate the start of a new bullish trend.
Support and Resistance: Trend lines can also act as dynamic support and resistance levels.

Conclusion: Master the Art of Reading Futures Trading Charts
Reading a futures trading chart may seem daunting at first, but with a solid understanding of candlestick patterns, moving averages, volume indicators, support and resistance levels, and trend lines, you can unlock valuable insights that will help you make more informed trading decisions.
The key to success lies in combining these tools to develop a clear market outlook. For example, you might identify a bullish candlestick pattern at a support level, confirmed by increasing volume, and use that as a signal to enter a trade.
Practice reading charts and identifying patterns on your own trading platform. Start with historical data to see how these indicators play out in real market conditions. As you gain confidence, incorporate more advanced strategies to refine your trading skills and improve your outcomes.
Suggested articles:
What Is Futures Trading And Why It’s Popular Among Traders
Top Benefits Of Trading Futures Markets
Dive deeper into how to read a futures trading chart in this excellent post from Bullish Bears:
How to Read Futures Trading Charts and Data (bullishbears.com)

